Selecting the correct indicators is essential to success in intraday trading. These technical indicators offer priceless information about momentum, trends, and possible entry and exit positions in the market.

We’ll explore the intriguing indicators of day trading in this blog post, revealing the top 5 indicators that professional traders rely on. Join us as we look into the indicators that can have a big impact on your day trading success, whether you’re an experienced trader looking for new insights or a novice looking for direction.
What’s The Importance of Indicators?
When it comes to determining when to enter and quit a trade, indicators are a trader’s greatest ally. thus it becomes important to choose Best Indicators For Day Trading to maximize the profit. Indicators examine key aspects of a stock price, such as underlying volume, price trend momentum, etc.
The following characteristics are the main means by which intraday trading indicators are categorized:
Trends
A trend can be used to determine the direction of the share price movement. Plotting share prices results in the joining of the points on the chart, which forms the trendline. The share prices’ upward or downward trend is shown by this trendline.
Momentum
Momentum is the rate at which the price of a stock changes. The determination of bullish or bearish momentum is based on the rate at which the share price is rising or falling. Bullish momentum is established and vice versa if share prices are consistently rising.
Volume
Before deciding whether to purchase or sell, dealers also consider volume as a crucial factor. The quantity of stocks purchased or sold within a specific time frame is used to calculate it. The volume of a stock indicates how frequently it is exchanged. When the volume is high for a given period of time, it indicates that there were a lot of buys and sales of the share during that time.
Volatility
One intraday measure of market erraticness is volatility. A stock that exhibits high volatility experiences abrupt fluctuations in share price over brief periods of time. Not only can volatility occur when share prices decline; but can also occur when share prices surge suddenly..

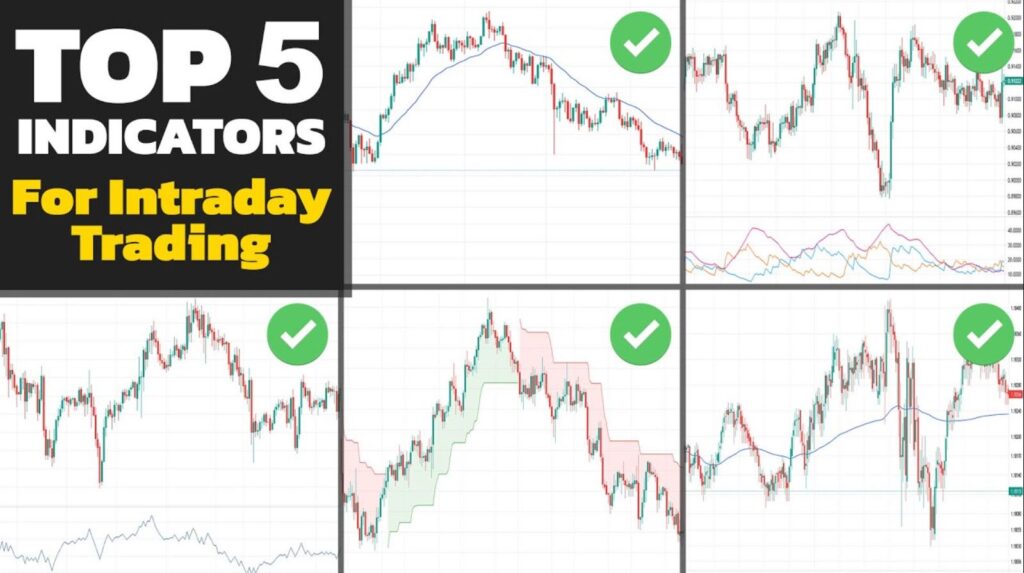
Here Are The 5 Best Indicators For Day Trading
1. Moving Averages
Moving Averages are a vital tool for day traders. By averaging prices over a predetermined length of time, Simple Moving Averages (SMA) and Exponential Moving Averages (EMA) make it easier to identify trends.
SMAs offer a simple average, whereas EMAs give recent prices greater weight.
Prices that cross above or below these averages may indicate future trend changes, which will help you decide when to purchase or sell.
A picture of a technical chart showing the Moving Average indicator.
2. Relative Strength Index (RSI)
A momentum indicator that evaluates the rate and size of price fluctuations in a financial asset is the Relative Strength Index. On a range of 0 to 100, it rates overbought or oversold conditions.
When an asset’s RSI is over 70, it may be overbought and due for a probable reversal; when it is below 30, it suggests that the market is oversold and that there may be an upward price correction. You can locate entry and exit points with the use of RSI.
3. Bollinger Bands
In day trading, Bollinger Bands are an invaluable tool. On a price chart, they are composed of three lines: two outer bands that show standard deviations from the middle band, and a central band that is typically a Simple Moving Average. The bands change size in response to changes in the market.
You can make more informed trading decisions when prices approach the outer bands, which indicate higher volatility and possible breakout or reversal points. Among the strongest technical indicators for day trading is this one as well.
4. Moving Average Convergence Divergence (MACD)
One potent indicator is the Moving Average Convergence Divergence (MACD). It helps you determine the strength and momentum of a stock by combining two moving averages.
A possible bullish trend is indicated when the MACD line crosses above the signal line; a negative trend is suggested when it crosses below. You can find important trading entry and exit moments with the help of MACD.
5. Stochastic Oscillator
You can assess a stock’s momentum with the use of the Stochastic Oscillator. It evaluates if the closing price at this time is close to the high or low range during a given time frame, usually 14 periods.
The indication may be overbought, indicating a possible selling opportunity, when it crosses above 80.
On the other hand, a rating below 20 suggests that the market may be oversold and that a buying opportunity might be approaching.
Related Read | Split Stocks Meaning, Types and Why Do Companies Go For Split Stocks?
Day Trading Strategies with Indicators
To help traders make wise choices in rapidly changing markets, day trading techniques frequently include a variety of technical indicators. Here are three well-liked indicators-based strategies:
1. Moving Average Crossovers
The Crossovers of the Moving Average Using a crossover method, two moving averages are used: a long-term (e.g., 21-period) and a short-term (e.g., 9-period).
A possible rally and a buying opportunity are indicated when the short-term moving average crosses over the long-term moving average (Golden Cross).
On the other hand, a potential downturn and a potential selling opportunity are indicated when the short-term moving average crosses below the long-term moving average (Death Cross).
Using moving average relationships as a base, this technique seeks to profit from shifts in trends.
2. Bollinger Bands Breakout
Bollinger Bands, which are made up of two outside bands that signify volatility and a middle band (SMA), are the foundation of the Bollinger Bands Breakout strategy. The bands show low volatility when they contract (narrow), which frequently happens before a big price shift.
When the price breaks above the top band, it may be in an uptrend; when it breaks below the lower band, it may be in a downtrend. Buy when this happens.
The goal of this technique is to profit from price changes that occur after times of low volatility or consolidation.
3. RSI and MACD Divergence
Two indicators are used in the RSI and MACD Divergence method to help spot possible trend reversals.
When the Moving Average Convergence Divergence (MACD) creates lower lows and the Relative Strength Index (RSI) forms higher lows, this is known as bullish divergence. This points to a potential reversal and a waning downward trend.
When this divergence happens, you might want to consider going long, but before you do, be sure using additional indicators and risk management strategies.

Conclusion
Identifying the optimal indicators for intraday trading needs an in-depth knowledge of market dynamics. Although there isn’t a single indication that works for everyone, a number of them have been shown to be helpful for intraday traders. Among the most widely used indicators include volume, Bollinger Bands, moving averages, and relative strength index (RSI). It’s important to keep in mind, though, that signs by themselves cannot ensure success. Traders need to combine their indicators with experience, market research, and sensible risk management techniques. Furthermore, in the fast-paced world of intraday trading, keeping ahead requires constant learning and adjustment to market patterns.