Embarking on the journey of swing trading requires more than just a keen eye for market trends; it demands a strategic approach to selecting the right stocks. In this blog, we’ll delve into the intricacies of stock selection for swing trading, providing you with the insights and tools necessary to navigate the markets successfully. Whether you’re a seasoned trader or a newcomer to the world of swing trading, understanding the principles behind selecting the most promising stocks is a crucial step towards building a robust and profitable trading strategy. Join us as we explore the art and science of choosing the right stocks for your swing trading endeavors.
What is Swing Trading Meaning ?
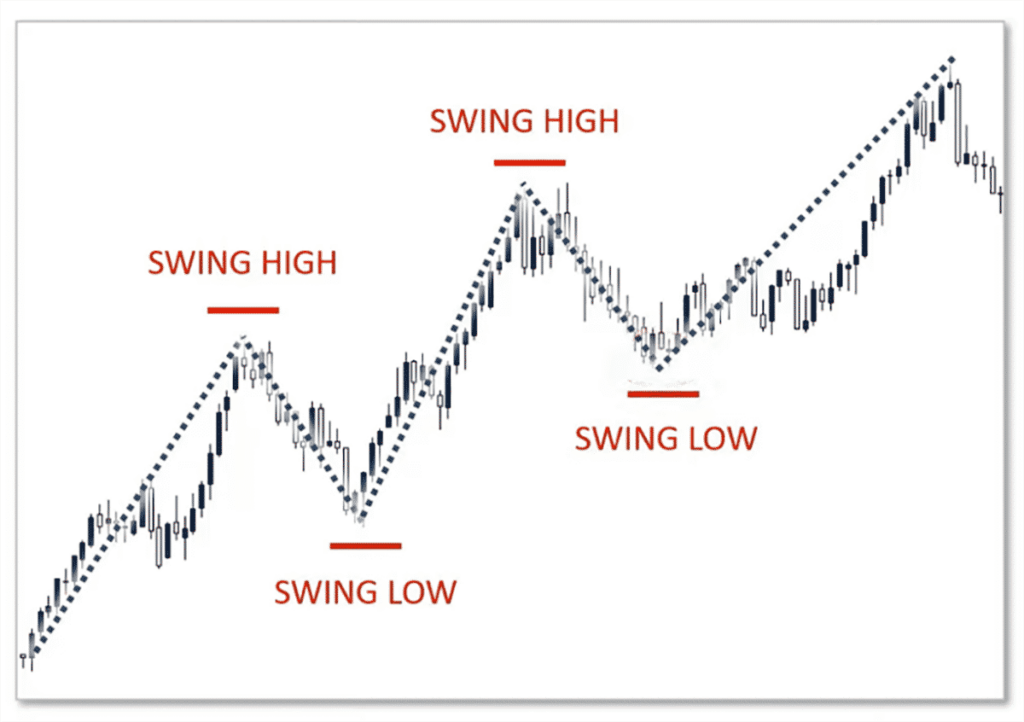
Swing trading is a type of trading that involves capturing price swings that happen over the short to medium term.
Selecting the appropriate timeframe for swing trading will help you identify the bigger trend that these swings are a part of.
A swing trader uses technical analysis to conduct research and makes sure they carefully choose financial assets before taking a position that they may hold for several days or weeks. Some even use basic analysis.
A swing trader’s primary goal is to make little profits from each trade in order to build up a sizable return on their investment.
Swing traders can profit from intermediate price moves while avoiding the cacophony of short-term fluctuations, giving them flexibility in the markets for those who cannot watch them all day.
How to Select Stocks for Swing Trading ?
The following pointers will answer how to select stocks for swing trading in India
- Manage Risk: Implement proper risk management techniques such as setting stop-loss orders and position sizing to protect your capital.
- Trade Liquid Stocks: Choosing a stock with high trading volume ensures that your transactions will go through with minimal slippage.
- Engage with Volatility: For swing trading to exist, there needs to be swings so ensure that there’s sufficient price volatility to generate potential profits.
- Monitor Price Trends: Identify stocks with clear uptrends or downtrends as these provide better opportunities for swing trading.
- Use Technical Analysis: Technical indicators and chart patterns can help you identify potential entry and exit points.
- Add Fundamental Analysis: Consider combining technical analysis with analyzing the fundamentals of the company (earnings, revenue, etc.) to assess medium to long-term potential.
- View Historical Performance: Examine past price data to spot trends or patterns that could recur in the future.
- Sector Analysis: Pay attention to particular industries or sectors that are showing promising trends at the moment or have advantageous market circumstances. To find industries with strong growth potential or advantageous catalysts that could raise stock values, do a sector study.
- Keep an eye on the Earnings Calendar: Determine which stocks are due to produce earnings reports during your chosen holding period by keeping an eye on the earnings calendar, which is a list of upcoming corporate actions. Liquidity and volatility should increase as a result.
- Read up on News and Events: Keep yourself informed about pertinent news and market developments that may affect the companies you are thinking about.
Top Tools for Identifying Swing Trading Stocks
Here are the top 5 tools that can help you identify the best swing trading opportunities:
1. Candlestick Charts
Technical charts with green-red or white-black candles must be familiar to you. These charts, which show the price movement over a given period of time, have come to be associated with trading. You can plan your entrance and exit and obtain insights into swings by using candlestick charts.
2. Volume
Volume provides information about how strong the present price trend is. Let’s say that the volume has been high for the past several days and that the XYZ stock is trading between the support and resistance levels. It implies that a breakout is possible and that you can take advantage of it.
3. Moving Average
In the same way as a mathematical average, the Moving Average (MA) is computed. All you have to do is multiply the previous prices by the number of days.
A rising price trend can be seen if the stock’s faster moving moving average relative strength (MA) line crosses the slower moving MA line from below.
4. Relative Strength Index (RSI)
The stock is overbought and you should think about selling it if the momentum indicator’s value is higher than 70.
The stock is oversold and trading well below its true value if the RSI number is less than thirty.
5. Stochastic Indicator
A stochastic oscillator can provide you with the solution to the question of where to find stocks for swing trading.
The XYZ stock is overbought if the reading is higher than 80. The stock is considered to be in an oversold area if it is less than 20.
6. Ease of Movement (EOM)
EOM is drawn on a chart where the baseline is zero. When the EOM rises above the zero level, then it shows that prices are rising with much more ease.
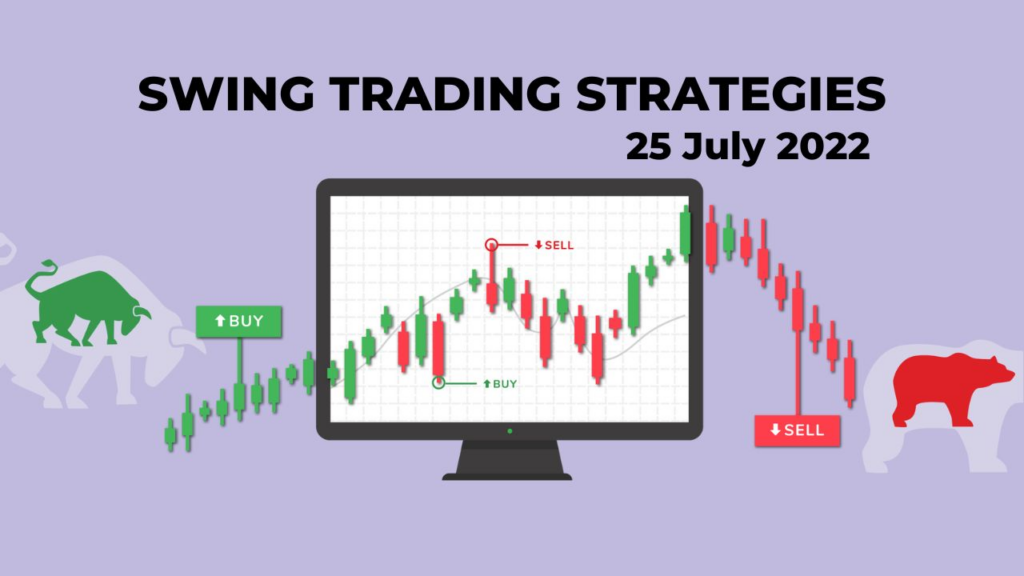
Top 6 Best Swing Trading Strategies
Some strategies can help you understand how to filter stocks for swing trading and you can also find entry or exit points.
1. Moving Average Crossover
The crossover of the short- and long-term moving averages is used in this approach to indicate when to enter or leave transactions.
A bearish crossover indicates a sell indication, whereas a bullish crossover indicates a buy signal.
When the short-term moving average crosses and rises above the long-term moving average, this is known as a bullish crossing.
When the short-term moving average crosses and descends below the long-term moving average, this is known as a bearish crossing.
Stop-loss orders based on the separation between the moving averages are commonly used by swing traders.
2. Breakout Trading
When the price of the stock you’re following crosses a significant resistance level on the charts, a breakout occurs.
When price breaks above resistance, most swing traders would go long, assuming that the upswing will continue.
To reduce possible losses, stop-loss orders are put below the breakout level.
3. Pullback Trading
In the sense that you wait for a stock to retrace from an uptrend to a support level, think of pullbacks as the opposite of breakouts.
Once it reaches that level, you can enter long positions at a reduced price.
In order to verify that the upswing is continuing, swing traders watch for indications of a bounce off the support level.
To control risk, traders typically set stop-loss orders below the support level.
4. Trend Reversal Trading
Trend Reversal Trading involves the identification of trend reversals to enter counter positions, meaning entering the opposite direction in anticipation of the reversal of the current trend.
Traders place stop-loss orders to limit potential losses if the reversal does not occur.
5. Range Trading
Trading inside a stock’s price range when it is consolidating or moving sideways is the foundation of range trading.
Usually, you would purchase close to support levels and sell close to resistance levels in an effort to profit from changes in price within the range.
If a breakout occurs, traders position stop-loss orders beyond the range boundaries to reduce risk.
6. Fibonacci Retracement
Fibonacci retracement levels can help identify possible support or resistance levels where the price may invert or continue its trend.
Swing traders use the 38.2%, 50%, and 61.8% retracement levels to identify areas of convergence with other technical indicators or patterns on charts.
Traders use Fibonacci retracement levels to identify support and resistance levels, placing stop-loss orders accordingly.
Here’s Some Best Swing Trading Books
Embark on a journey of knowledge and expertise with the best swing trading books that promise to unravel the secrets of successful trading strategies and market navigation.
- How To Swing Trade
- Swing Trading for Beginners: 7 Golden Rules for Making a Full-Time Income
- The Master Swing Trader
- The Ultimate Guide to Swing Trading
- Day Trading and Swing Trading the Currency Market
- In Depth Guide to Price Action Trading
- Swing Trading: Power Strategies to Cut Risk and Boost Profits
- Swing Trading as a Part Time Job
- Swing Trading With Technical Analysis
- Best Swing Trading Indicators Guide
Chartink Screener for Swing Trading
Chartink’s screener for swing trading is a powerful tool that empowers traders to refine their stock selection process with precision. Offering a user-friendly interface and real-time data, this platform allows users to customize filters based on technical indicators, moving averages, and chart patterns to align with their unique swing trading strategies. The incorporation of pattern recognition tools, such as identifying triangles, flags, and head-and-shoulders formations, adds an extra layer of sophistication.
By diligently applying defined criteria and analyzing the results, traders can efficiently narrow down potential opportunities. Chartink’s versatility and adaptability make it an invaluable asset for swing traders seeking to stay ahead of market trends and make informed decisions in the dynamic world of short to medium-term trading.
Also Read – Split Stocks Meaning, Types and Why Do Companies Go For Split Stocks?
Conclusion
In conclusion, mastering the art of swing trading involves a multifaceted approach, from understanding the principles of stock selection to implementing effective strategies and utilizing the right tools. The journey begins with recognizing the importance of a strategic approach to stock selection, whether you are a seasoned trader or a newcomer to the swing trading arena. The blog has provided a comprehensive guide on how to select stocks for swing trading, emphasizing risk management, technical and fundamental analysis, and considerations like liquidity, volatility, and market trends.
The inclusion of top tools such as candlestick charts, volume analysis, moving averages, RSI, stochastic indicators, and Ease of Movement (EOM) adds depth to the trader’s analytical toolkit. Additionally, the blog outlines six potent swing trading strategies, each tailored to different market conditions. Lastly, Chartink’s screener emerges as a powerful ally, streamlining the stock selection process with its customizable filters and real-time data. As you embark on your swing trading journey, incorporating these insights and tools can significantly enhance your ability to identify and capitalize on profitable opportunities in the dynamic world of short to medium-term trading.